Error Log
The error log holds server errors, warnings and events. It has two tabs, because Primentra logs to two places at once.
Access: Settings → Log Viewer → System Log or Database Log
Two logs, one purpose
| System Log | Database Log | |
|---|---|---|
| Stored in | errorlog.txt on the server | the ErrorLog table |
| Contains | every event, always | only the categories you enable |
| Survives a database outage | Yes | No |
| Cleaned by retention | No | Yes |
The file is the complete record. The database copy is the searchable one. Configure which categories reach the database on the General tab — see General Settings.
System Log tab
A bar at the top shows the file name, the line count and the file size, and downloads errorlog.txt when you click it.
The grid has five columns: Timestamp, Level, Status, Path and Message. All five sort client-side; click a header to cycle the direction.
- Filter by level: Errors only, Warnings only or Info only
- Search messages and paths
- Click a row to expand the full stack trace and request body, each with a copy button
- Refresh reloads, Export writes JSON, CSV or XLSX
- Purge File deletes
errorlog.txtand every rotation. Primentra asks first
The tab reads the last 200 lines by default, up to a maximum of 1000.
File rotation
The file rotates at 10 MB. Primentra keeps three rotations — errorlog.1.txt, errorlog.2.txt and errorlog.3.txt — so the log occupies at most about 40 MB on disk. Rotation is automatic and needs no configuration.
Database Log tab
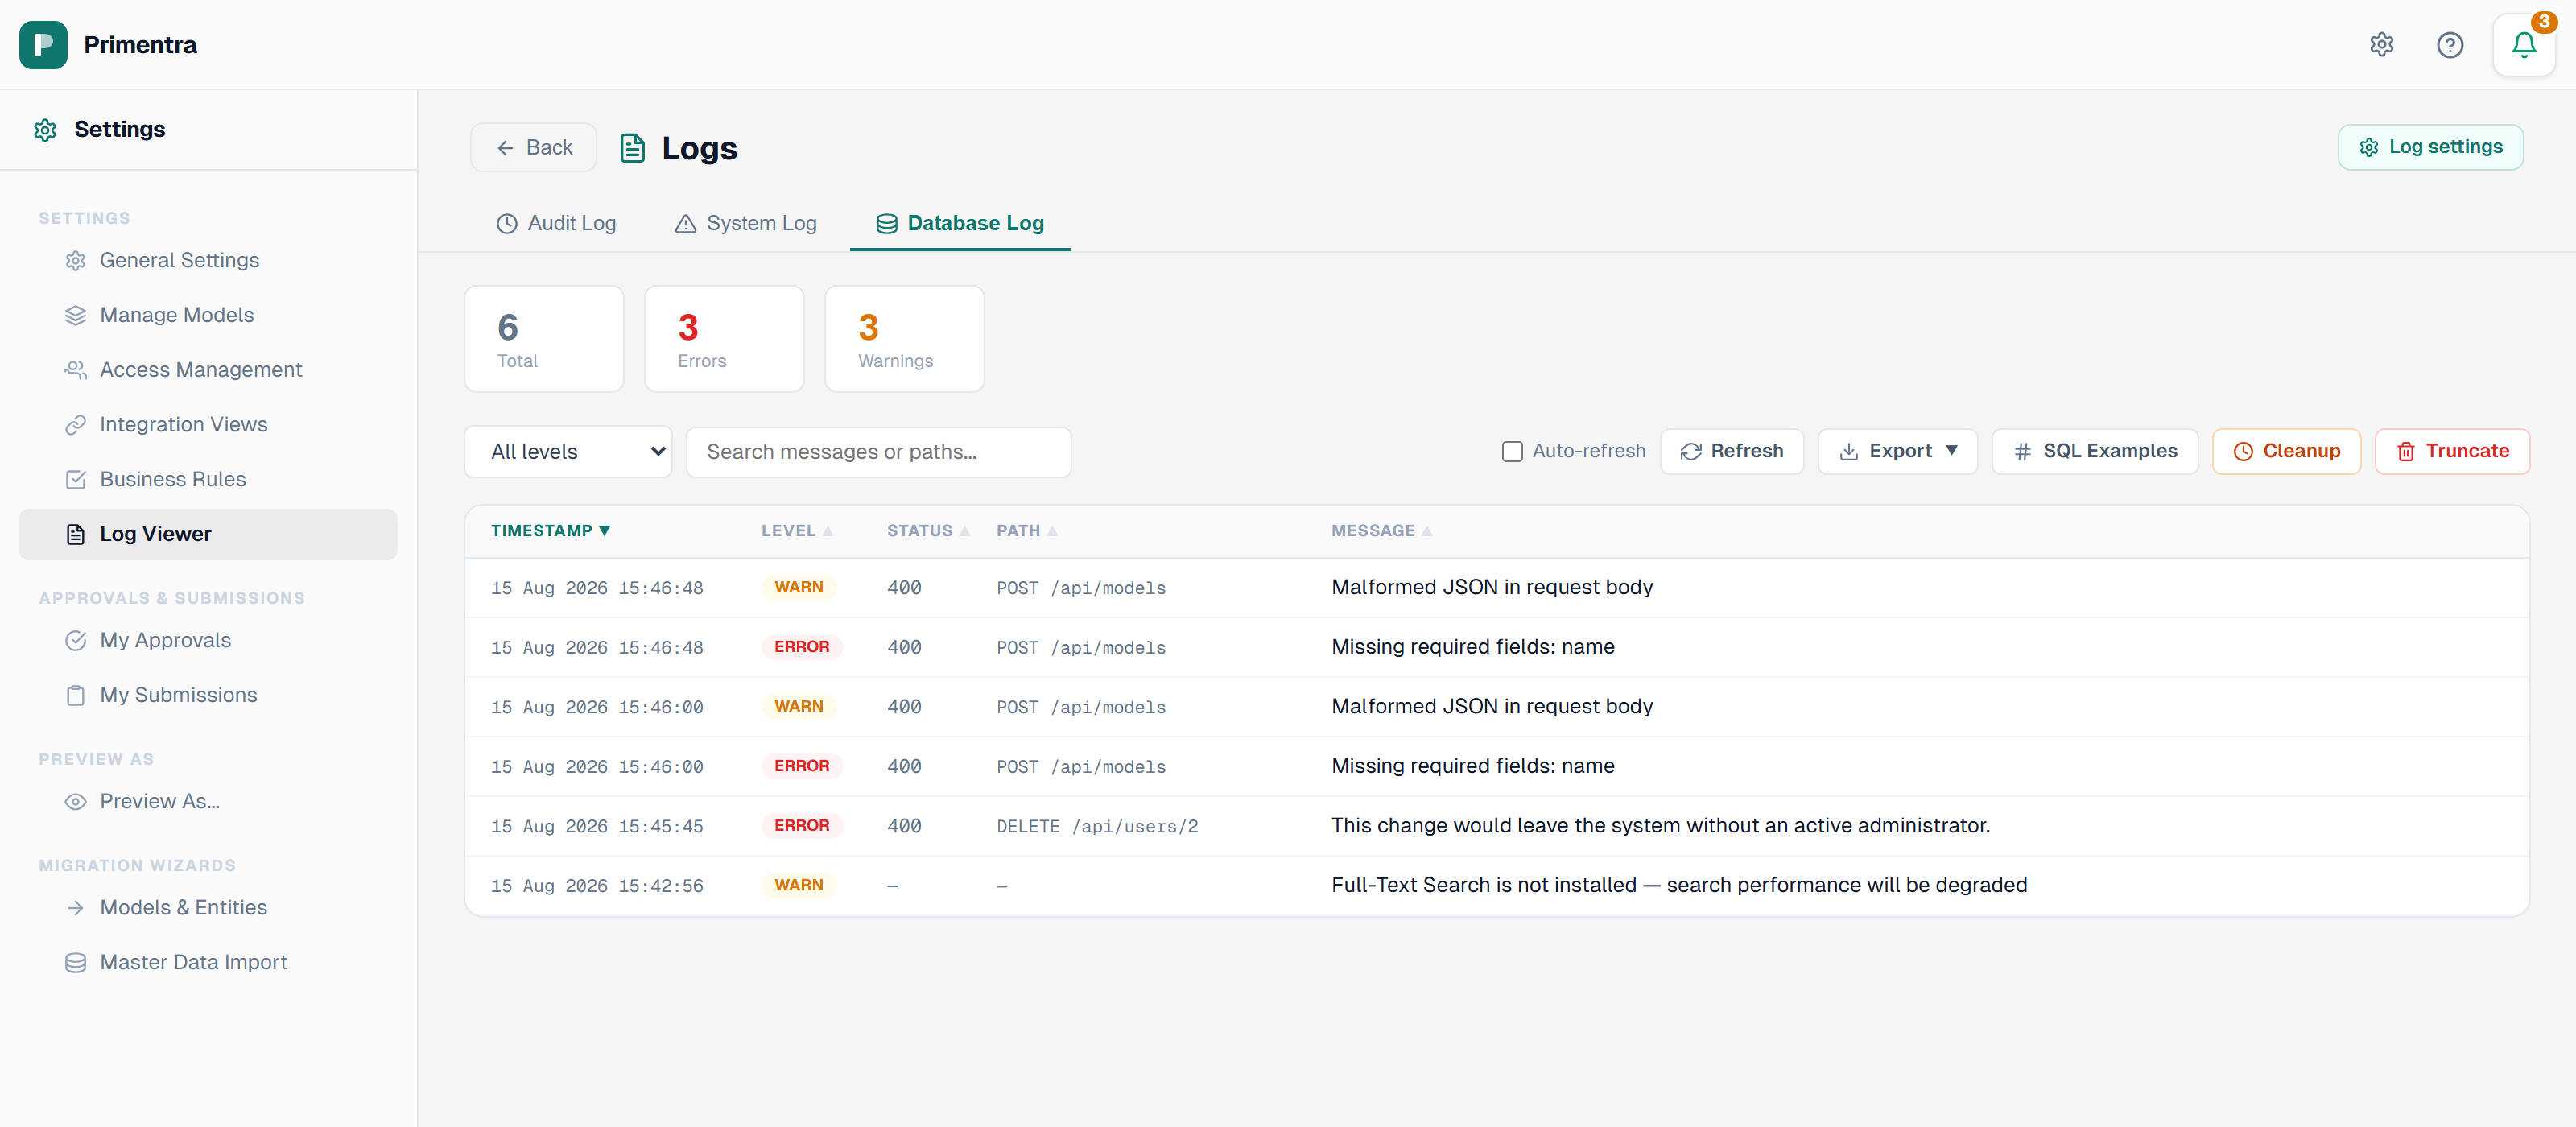
Three cards at the top count Total, Errors and Warnings.
- Filter by level and search messages and paths. Both run server-side
- Sort by clicking a column header. Sorting is server-side too
- Auto-refresh reloads the current page every 30 seconds
- Refresh reloads once
- Export writes the loaded page to JSON, CSV or XLSX
- SQL Examples opens ready-made queries with copy buttons
- Cleanup deletes entries older than 7, 14, 30, 60, 90, 180 or 365 days
- Truncate deletes every entry. Primentra asks first
Entries are paginated server-side. Click a row to expand its detail.
Technical reference
Stored procedures
| Procedure | Purpose |
|---|---|
usp_ErrorLog_Write | Inserts an entry |
usp_ErrorLog_Get | Paginated retrieval with level, search, date and sort |
usp_ErrorLog_GetStats | The counts behind the stats cards |
usp_ErrorLog_Cleanup | Deletes entries older than a retention period |
usp_ErrorLog_Truncate | Deletes every entry |
Example queries
Query the ErrorLog table directly in SSMS or any SQL client. The same queries are behind the SQL Examples button.
Recent errors, last 24 hours:
Errors grouped by path, most frequent first:
Slow requests over two seconds:
Error summary by day:
Search for a message:
Related
- General Settings — which categories reach the database
- Data Retention — scheduled cleanup of the
ErrorLogtable - Audit Log — the third tab of the same screen
- Health & Monitoring — what to poll instead of reading logs