Logs
Audit Log
Full audit trail of all data changes and security events.
Filtering:
- Filter by date range (start and end date)
- Filter by action type using a grouped dropdown:
- Data group: Edit, Create, Delete, Import
- Security group: Login, Failed login, Account locked, Logout, User created, User updated, User deleted, First setup, Welcome email, Password changed, Password set (forced)
- Filter by model and entity (auth and user management events use entity "Authentication" and model "System")
- Search by user, comment, or field name
Entry details:
- Each entry shows: user, timestamp, action badge (color-coded), and entity name
- Expand any data entry (edit, create, delete, import) to see field-level details with old → new values per record
- Expand any security entry (login, user management) to see event details: email, IP address, and display name
- New records show a NEW badge
Export:
- Export the full audit log to JSON, CSV, or XLSX
- Export includes complete field-level change data
─── Technical ───
Database table: `AuditLog`
| Column | Type | Description |
|---|---|---|
Id | BIGINT | Primary key (auto-increment) |
EntityId | INT | Foreign key → Entities.Id |
EntityName | NVARCHAR(200) | Entity name at time of action |
ModelName | NVARCHAR(200) | Model name at time of action |
Action | NVARCHAR(50) | Data actions: create, edit, delete, import, create/edit, purge. Security actions: login_success, login_failed, account_locked, logout, first_user_setup, user_created, user_updated, user_deleted, welcome_email_sent, password_changed, password_forced_change. Permission actions: permission_change |
RecordCount | INT | Number of rows affected |
UserId | INT | Foreign key → Users.Id. The audit log UI resolves this to the user's email address automatically. If a user is deleted, the numeric ID is shown as a fallback |
Comment | NVARCHAR(1000) | Optional save comment |
Details | NVARCHAR(MAX) | JSON with field-level change data (array for data actions, object for permission changes) |
CreatedAt | DATETIME2 | Timestamp (UTC) |
How entries get written:
The AuditLog table is append-only — entries are never modified after creation (only deleted by the scheduled cleanup after the retention window expires). An entry is written automatically by the stored procedure responsible for each operation, inside the same transaction as the change itself. If the data save fails and the transaction rolls back, the audit entry is rolled back too — so there are never phantom audit entries for changes that didn't actually happen.
| Event | When an entry is written |
|---|---|
| Data row saved (new, edited, or mixed) | usp_Data_SaveChanges — one entry per save batch, RecordCount = number of rows |
| Data row deleted | usp_Data_Delete — one entry for the batch |
| Data imported via Migration Wizard | Import stored procedure — one entry per entity |
| Permission changed | usp_Permission_BulkSave writes one entry per changed permission. Saving a role with 10 changed permissions creates 10 entries. |
| Single permission upserted | usp_Permission_Upsert — one entry if anything actually changed |
| Login success / failure | Authentication handler in the API server |
| Account locked after failed attempts | Authentication handler |
| User created, updated, or deleted | User management routes |
| Password changed or reset | Password change route |
| First user setup completed | Setup route |
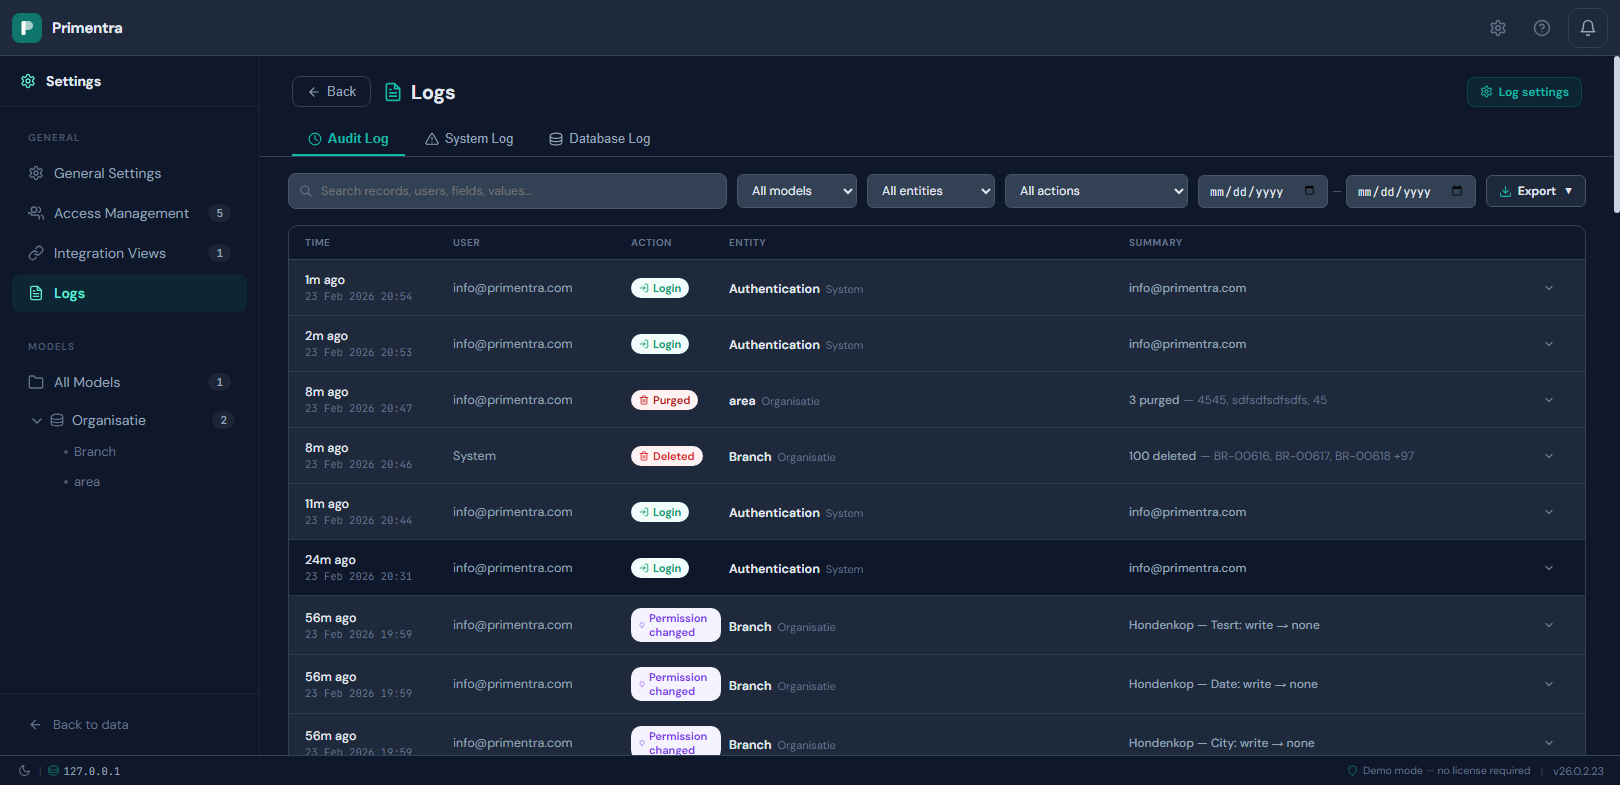
Viewing entries in the audit log:
All entries are visible in Settings → Logs → Audit Log. The UI shows each entry with the acting user's email address, the action type (colour-coded badge), the target entity, and a one-line summary. Click any row to expand it and see the full detail:
- Data entries show a before/after table of every changed field
- Permission entries show the role, scope (model / entity / attribute), and the exact flags that changed with their old and new values
- Security entries show event details such as email, IP address, or number of remaining login attempts
You can filter by model, entity, action category (Data, Security, or Permissions), and date range. The full result set can be exported to JSON, CSV, or XLSX.
How the `Details` JSON is structured:
The Details column stores a JSON array. Each element represents one row that was affected. The structure differs by action type:
Create — all field values of the new row:
Edit — only the fields that were actually changed:
Delete — a full server-side snapshot of every deleted row's values (always saved automatically):
Internal fields in the JSON:
code— the row's Code value (always present, used to identify the row)name— the row's Name value (always present)_savedId— the database row ID (EntityRows.Id). Used internally by the audit panel to match entries to specific rows. Not displayed in the UI.
Domain attribute resolution:
Domain attributes (fields that reference another entity) are resolved at write time. Instead of storing the raw database ID (e.g., 131), the audit log stores the display value in {Code} Name format (e.g., {NL} Netherlands). This ensures audit entries remain readable even if the referenced record is later modified or deleted.
Changed fields tracking:
When editing existing rows, the frontend sends a changedFields array per row. The backend uses this to filter the audit details — only fields that were actually modified are included. This prevents unchanged fields from cluttering the audit trail.
Permission change entries:
When a permission is changed via the Roles & Permissions screen, one AuditLog entry is written per individual permission change with Action = permission_change and RecordCount = 1. The Details field is a JSON object (not an array) with the following structure:
For attribute scope, attributeId and attributeName are also included, and changes contains level with the old and new value. Only flags that actually changed are present in the changes object.
For attribute-level permissions, the level values in changes are the effective levels — not the raw stored value. When a user sets an attribute to Inherit, the permission row is removed from the database. The audit log resolves what the inherited level actually is (by looking at the entity-level permission, then the model-level permission for the same role) and records that effective value. This means the audit entry shows "to": "read" rather than the meaningless "to": "none" that would otherwise appear.
Batch saves:
All row saves in a single save operation are stored in one AuditLog entry with RecordCount reflecting the number of rows. The Details JSON array contains one element per row. The Action is set to:
create— if all rows are newedit— if all rows are existingcreate/edit— if the batch contains both new and existing rows
Stored procedures:
usp_AuditLog_Write— inserts a new audit log entryusp_AuditLog_GetPaginated— retrieves paginated entries (admin audit log view)usp_AuditLog_GetByRow— retrieves entries for a specific row by Code and/or row ID (audit panel)usp_AuditLog_Cleanup— deletes entries older than the configured retention periodusp_AuditLog_ResolveAttributes— maps attribute IDs to display names for the admin view
Automatic cleanup:
A SQL Server Agent job runs usp_Maintenance_Cleanup periodically. This stored procedure reads auditRetentionDays from the AppSettings table (default: 90) and calls usp_AuditLog_Cleanup:
Example with 90-day retention and today = 19 Feb 2026:
The cutoff shifts forward by one day for each day that passes — so the audit log always covers exactly the configured retention window.
When entries are actually deleted, the result is logged to the SchedulerLog table with event type cleanup, including the number of deleted records, retention period, and cutoff date. No-op runs are not logged. Configuration is in Settings → General Settings → Retention tab.
Error Log
View server errors and warnings via Settings → Logs. The Error Log is split into two tabs within the Logs view: System Log (file-based) and Database Log.
System Log tab (reads from errorlog.txt):
- Structured grid with columns: Timestamp, Level, Status, Path, Message
- All columns sortable (client-side)
- Filter by level and search text
- Click any row to expand the full stack trace and request body
- Purge file button deletes the log file and all rotations
- File size and line count shown in the header
Database Log tab (reads from the ErrorLog table):
- Same structured grid with server-side pagination and sorting
- Filter by level, search text, and date range
- Click any row to expand details
- Truncate button removes all database log entries
- Cleanup button removes entries older than a configurable number of days
- Stats cards show total entries, errors, warnings, and info counts
- Auto-refresh toggle (polls every 30 seconds)
Dual logging architecture:
- File: All events are always written to
errorlog.txtas JSON lines, regardless of category settings. The file rotates automatically at 10 MB (max 3 rotations = 30 MB ceiling). - Database: Entries are filtered by the log category settings in General Settings before being written to the ErrorLog table.
Log category settings (General Settings → General tab):
- HTTP errors (5xx) — server errors and unhandled exceptions (default: on)
- Client errors (4xx) — bad requests, not found, validation errors (default: on)
- Slow requests — requests exceeding a configurable threshold in milliseconds (default: off, threshold: 5000ms)
- Server events — startup, shutdown, database connection changes (default: on)
The system log file always records everything regardless of these settings. Category settings only control what gets written to the database.
Retention: Error log retention is configured separately in the Retention tab (default: 30 days). See Data Retention for details on how automatic cleanup works.
Stored procedures:
usp_ErrorLog_Write— inserts a new error log entryusp_ErrorLog_Get— paginated retrieval with level, search, date, and sortingusp_ErrorLog_Cleanup— deletes entries older than the retention periodusp_ErrorLog_Truncate— deletes all entries from the ErrorLog tableusp_ErrorLog_GetStats— summary counts for the stats cards
Example SQL queries:
You can also query the ErrorLog table directly in SQL Server Management Studio (SSMS) or any SQL client. The Database Log tab in the app includes these example queries with a copy button for convenience.
Recent errors (last 24 hours):
Errors grouped by path (most frequent):
Slow requests (> 2 seconds):
Error summary by day:
Search for a specific error message: